
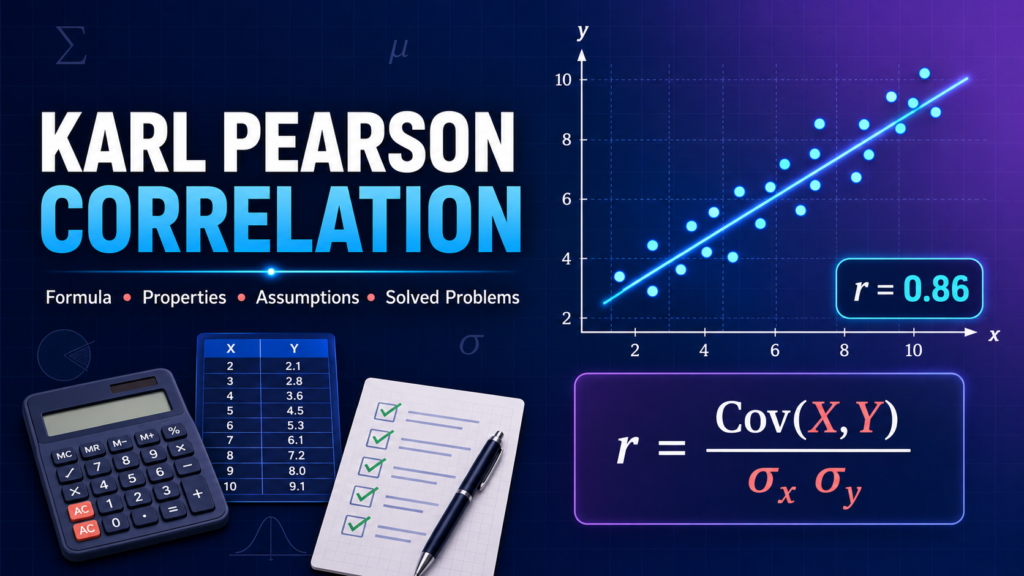
Do students who study more hours score higher marks? Does a shop sell more cold drinks when the temperature rises? Questions like these are asking whether two things move together.
Karl Pearson’s coefficient of correlation answers that question with a single number. That number tells you two things at once: whether the two variables move in the same direction or opposite directions, and how strongly they are connected.
This guide explains what the coefficient means, gives the formulas you need, and works through solved problems step by step.
What is Karl Pearson Coefficient of Correlation?
Karl Pearson’s coefficient of correlation, written as r, is a number that measures how strongly two variables are related to each other and in which direction.
It was given by the English statistician Karl Pearson in 1896. It is also called the product moment coefficient of correlation.
The value of r always lies between minus 1 and plus 1.
- A positive value means both variables move in the same direction. When one goes up, the other goes up.
- A negative value means they move in opposite directions. When one goes up, the other comes down.
- A value close to zero means there is no real connection between them.
Simple examples:
| Pair of variables | Type of correlation |
|---|---|
| Hours studied and marks scored | Positive |
| Temperature and sale of cold drinks | Positive |
| Price of a product and its demand | Negative |
| Speed of a vehicle and time taken | Negative |
| Height of a student and marks in Kannada | No correlation |
Formula of Karl Pearson Coefficient of Correlation
There are three formulas. All three give the same answer. You choose one based on the numbers in the question.
1. Direct method formula
Use this when the mean is not a whole number, or when the numbers are small.
r = [NΣXY − (ΣX)(ΣY)] ÷ √{[NΣX² − (ΣX)²] × [NΣY² − (ΣY)²]}
Here N is the number of pairs.
2. Actual mean method
Use this when the mean of both series is a whole number.
r = Σxy ÷ √(Σx² × Σy²)
Here x = X − X̄ and y = Y − Ȳ
3. Assumed mean or shortcut method
Use this when the numbers are large and the mean is an awkward fraction.
r = [NΣdxdy − (Σdx)(Σdy)] ÷ √{[NΣdx² − (Σdx)²] × [NΣdy² − (Σdy)²]}
Here dx = X − A and dy = Y − B, where A and B are any values you choose.
How to pick the right method: look at the mean first. If both means are whole numbers, use the actual mean method, because it is the shortest. If not, use the direct method. If the raw numbers are very large, use the assumed mean method.
Assumptions of Karl Pearson Coefficient of Correlation
The coefficient works properly only when these conditions are true.
- The relationship is linear. If you plot the pairs on a graph, the points roughly form a straight line.
- There is a real connection between the two variables. It makes no sense to correlate two unrelated things, like a student’s height and the price of rice.
- The data is numerical. Both variables must be measurable in numbers. Qualities like honesty or beauty cannot be measured this way.
- The observations come in pairs. Every X value must have a matching Y value for the same person, item or period.
- Many small causes affect each variable, so that the values are spread out in a normal pattern rather than being controlled by one factor.
Properties of Karl Pearson Coefficient of Correlation
- The value always lies between −1 and +1. If your answer falls outside this range, you have made a calculation mistake somewhere.
- It has no unit. Whether you measure height in centimetres or inches, r stays the same. This makes it easy to compare different sets of data.
- It does not change if you add or multiply. If you add the same number to every value, or multiply every value by the same number, r does not change. This is exactly why the shortcut method works.
- The order does not matter. The correlation between X and Y is the same as the correlation between Y and X.
- If r is zero, there is no linear relationship, but the two variables may still be connected in some other way.
- r squared tells you how much is explained. If r is 0.8, then r² is 0.64, which means 64 percent of the change in one variable is explained by the other.
Karl Pearson Coefficient of Correlation Problems With Solutions
Problem 1: Direct method
Calculate Karl Pearson’s coefficient of correlation from the following data.
| X | 1 | 2 | 3 | 4 | 5 |
|---|---|---|---|---|---|
| Y | 2 | 5 | 3 | 8 | 7 |
Solution
Make a table with five columns.
| X | Y | X² | Y² | XY |
|---|---|---|---|---|
| 1 | 2 | 1 | 4 | 2 |
| 2 | 5 | 4 | 25 | 10 |
| 3 | 3 | 9 | 9 | 9 |
| 4 | 8 | 16 | 64 | 32 |
| 5 | 7 | 25 | 49 | 35 |
| 15 | 25 | 55 | 151 | 88 |
N = 5, ΣX = 15, ΣY = 25, ΣX² = 55, ΣY² = 151, ΣXY = 88
r = [5(88) − (15)(25)] ÷ √{[5(55) − 225] × [5(151) − 625]}
r = [440 − 375] ÷ √{[275 − 225] × [755 − 625]}
r = 65 ÷ √(50 × 130)
r = 65 ÷ √6500 = 65 ÷ 80.62
r = 0.81
Answer: There is a high degree of positive correlation between X and Y.
Problem 2: Actual mean method
Calculate the coefficient of correlation.
| X | 2 | 4 | 6 | 8 | 10 |
|---|---|---|---|---|---|
| Y | 4 | 8 | 6 | 12 | 10 |
Solution
First find the means.
X̄ = 30 ÷ 5 = 6
Ȳ = 40 ÷ 5 = 8
Both are whole numbers, so we can use the actual mean method.
| X | Y | x = X − 6 | y = Y − 8 | x² | y² | xy |
|---|---|---|---|---|---|---|
| 2 | 4 | −4 | −4 | 16 | 16 | 16 |
| 4 | 8 | −2 | 0 | 4 | 0 | 0 |
| 6 | 6 | 0 | −2 | 0 | 4 | 0 |
| 8 | 12 | 2 | 4 | 4 | 16 | 8 |
| 10 | 10 | 4 | 2 | 16 | 4 | 8 |
| 0 | 0 | 40 | 40 | 32 |
r = 32 ÷ √(40 × 40) = 32 ÷ 40
r = 0.80
Important check: the totals of the x and y columns must both come to zero. If they do not, your mean or your subtraction is wrong. Fix it before going further.
Problem 3: Assumed mean method
Find the correlation between the height of fathers (X) and the height of sons (Y).
| X | 65 | 66 | 67 | 67 | 68 | 69 | 70 | 72 |
|---|---|---|---|---|---|---|---|---|
| Y | 67 | 68 | 65 | 68 | 72 | 72 | 69 | 71 |
Solution
The numbers are large and the mean is not a whole number, so we take assumed means. Let A = 68 and B = 69.
| X | Y | dx | dy | dx² | dy² | dxdy |
|---|---|---|---|---|---|---|
| 65 | 67 | −3 | −2 | 9 | 4 | 6 |
| 66 | 68 | −2 | −1 | 4 | 1 | 2 |
| 67 | 65 | −1 | −4 | 1 | 16 | 4 |
| 67 | 68 | −1 | −1 | 1 | 1 | 1 |
| 68 | 72 | 0 | 3 | 0 | 9 | 0 |
| 69 | 72 | 1 | 3 | 1 | 9 | 3 |
| 70 | 69 | 2 | 0 | 4 | 0 | 0 |
| 72 | 71 | 4 | 2 | 16 | 4 | 8 |
| 0 | 0 | 36 | 44 | 24 |
N = 8, Σdx = 0, Σdy = 0, Σdx² = 36, Σdy² = 44, Σdxdy = 24
r = [8(24) − 0] ÷ √{[8(36) − 0] × [8(44) − 0]}
r = 192 ÷ √(288 × 352)
r = 192 ÷ √101376 = 192 ÷ 318.40
r = 0.60
Answer: There is a moderate positive correlation between the heights of fathers and sons.
How to Read the Value of r
| Value of r | What it means |
|---|---|
| +1 | Perfect positive correlation |
| +0.75 to +1 | High positive |
| +0.50 to +0.75 | Moderate positive |
| +0.25 to +0.50 | Low positive |
| 0 | No correlation |
| −0.25 to −0.50 | Low negative |
| −0.50 to −0.75 | Moderate negative |
| −0.75 to −1 | High negative |
| −1 | Perfect negative correlation |
When a question asks you to comment on your answer, mention two things: the direction, whether positive or negative, and the degree, whether high, moderate or low.
Checking Your Answer With a Calculator or Excel
If you want to check a hand calculation, both a scientific calculator and Excel can find r for you.
In Excel or Google Sheets, put the X values in one column and the Y values in the next, then type:
=CORREL(A2:A6, B2:B6)On a scientific calculator, switch to statistics mode, choose the two variable option, enter each X value with its Y value, and then look for r in the regression menu. The exact buttons differ by model, so check yours once and write the steps in your notebook.
Use this only to check your work. In the exam, marks are given for the table, the totals and the substitution into the formula. An answer with no working gets very little, even if the number is correct.
Advantages of Karl Pearson’s Method
- It gives both the direction and the strength of the relationship in one number
- It uses every observation in the data, not just a few
- Because it has no unit, results from different studies can be compared
- It is the most widely used and accepted method of measuring correlation
Limitations You Should Know
It only works for straight line relationships. If the connection between the two variables is curved, this method will give a misleading answer.
One extreme value can change the result. A single unusually high or low figure can pull r up or down noticeably.
Correlation does not mean cause. This is the most important point in the whole chapter. Two things can move together without one causing the other. Ice cream sales and swimming accidents both rise in summer, but ice cream does not cause accidents. Hot weather causes both.
It cannot be used for qualities. Things that can only be ranked, such as beauty or honesty, need Spearman’s rank correlation instead.
It takes time by hand when there are many pairs of values.
Mistakes to Avoid in the Exam
- Getting an answer outside the range of −1 to +1. Recheck your arithmetic.
- Forgetting to check that the x and y columns total zero in the actual mean method.
- Losing the minus sign. The sign comes from the top of the fraction. The bottom is always positive.
- Using the actual mean method when the mean is a fraction. Switch to the direct method instead.
- Confusing r with r². The square is the one that gives the percentage explained.
- Writing only the final number without the table and the formula.
Where This Takes You Next
Correlation leads directly into regression, which is how businesses forecast sales, how economists predict demand, and how data analysts build models. The same idea you are learning with eight pairs of values is used on lakhs of records in market research and analytics work.
If you enjoy this kind of work, statistics runs right through commerce and management study. You can look at the PU Commerce programme at Trinity College to see how statistics fits alongside accountancy and economics in the two PUC years.
Frequently Asked Questions
What is Karl Pearson coefficient of correlation in simple words?
It is a number between minus 1 and plus 1 that tells you whether two variables move together or in opposite directions, and how strong that connection is.
What is the formula of Karl Pearson coefficient of correlation?
The direct method formula is r = [NΣXY − (ΣX)(ΣY)] divided by the square root of [NΣX² − (ΣX)²] multiplied by [NΣY² − (ΣY)²].
What is the range of r?
The value always lies between minus 1 and plus 1. Plus 1 means perfect positive correlation, minus 1 means perfect negative correlation, and zero means no correlation.
What are the assumptions of Karl Pearson coefficient of correlation?
The relationship must be linear, there must be a real connection between the variables, the data must be numerical, the observations must come in pairs, and each variable should be affected by many small causes.
Which method should I use in the exam?
Check the mean first. If both means are whole numbers, use the actual mean method. If not, use the direct method. If the numbers are very large, use the assumed mean method.
Does correlation mean one thing causes the other?
No. Correlation only shows that two things move together. It does not prove that one causes the other. Both may be caused by a third factor.
What is the difference between Karl Pearson and Spearman correlation?
Karl Pearson’s method uses the actual values and needs numerical data. Spearman’s method uses ranks instead of values, so it can be used for qualities that can only be ranked.
Final Word
This chapter is easier than it looks. Pick the right method, make the table carefully, check your totals, and substitute into the formula. Then finish the answer properly by saying what the number means in words. That last line is where most students lose an easy mark.
About the Author
Dr. Shama E M is the Principal of Trinity Institutions, Mysuru. With extensive experience in academic leadership and pre university education, she works closely with faculty and students to build conceptual clarity in core subjects and to guide students towards well informed academic and career decisions.