
Marginal costing answers a question that ordinary cost accounting cannot: what does it actually cost the business to produce one more unit, and is that unit worth producing at all? A factory may report a total cost of ₹90 per unit and still be right to accept an order at ₹75, because the fixed portion of that ₹90 is being paid whether the order is accepted or not.
That single insight is why marginal costing sits at the heart of managerial decision making, and why the technique appears in commerce syllabi, in economics as marginal cost, and in every cost accounting paper from B.Com to CA Inter.
This guide covers the definition of marginal cost and marginal costing, every formula you need, the features of the technique, a fully worked example, the shape of the marginal cost curve and why it is U-shaped, the relationship between marginal cost and marginal revenue, and the benefits and limitations of the system.
Marginal Cost Definition
Marginal cost is the additional cost incurred in producing one more unit of output. Because fixed costs do not change with the level of output within a given capacity, marginal cost consists entirely of variable costs. It is the amount by which total cost increases when output increases by one unit.
In economics, marginal cost is expressed as the rate of change of total cost with respect to quantity:
Marginal Cost = Change in Total Cost ÷ Change in Quantity
In cost accounting, marginal cost is built up from its components:
Marginal Cost = Direct Material + Direct Labour + Direct Expenses + Variable Overheads
Both definitions describe the same quantity. Economics arrives at it by differentiation, accounting arrives at it by classification.
Marginal Costing Definition
Marginal costing is a costing technique in which only variable costs are charged to units of output, while fixed costs are treated as period costs and written off in full against the contribution of the period in which they arise.
The Chartered Institute of Management Accountants describes it as the accounting system in which variable costs are charged to cost units and fixed costs of the period are written off in full against the aggregate contribution.
Note the word technique. Marginal costing is not a method of costing like job costing or process costing. It is a technique of presenting and analysing cost data, and it can be applied alongside any costing method.
Marginal Cost vs Marginal Costing
| Basis | Marginal Cost | Marginal Costing |
|---|---|---|
| Nature | A cost figure | A technique of cost presentation |
| Meaning | Additional cost of producing one more unit | System of charging only variable costs to products |
| Scope | A single number | A complete approach to reporting and decision making |
| Use | Input to calculation | Framework for pricing, planning and control |
Marginal Costing Formula: Complete List
| Concept | Formula |
|---|---|
| Marginal Cost | Change in Total Cost ÷ Change in Output |
| Marginal Cost (build up) | Direct Material + Direct Labour + Direct Expenses + Variable Overheads |
| Contribution | Sales minus Variable Cost |
| Contribution (alternative) | Fixed Cost + Profit |
| Contribution per unit | Selling Price per unit minus Variable Cost per unit |
| Profit | Contribution minus Fixed Cost |
| Profit Volume Ratio | (Contribution ÷ Sales) × 100 |
| P/V Ratio (from changes) | (Change in Profit ÷ Change in Sales) × 100 |
| Break Even Point in units | Fixed Cost ÷ Contribution per unit |
| Break Even Point in value | Fixed Cost ÷ P/V Ratio |
| Margin of Safety | Actual Sales minus Break Even Sales |
| Margin of Safety ratio | (Margin of Safety ÷ Actual Sales) × 100 |
| Sales for a desired profit (units) | (Fixed Cost + Desired Profit) ÷ Contribution per unit |
| Sales for a desired profit (value) | (Fixed Cost + Desired Profit) ÷ P/V Ratio |
| Profit (from margin of safety) | Margin of Safety × P/V Ratio |
The last formula is the most useful self check in an exam. If your profit figure calculated directly does not match margin of safety multiplied by the P/V ratio, one of your earlier steps is wrong.
Marginal Costing Features
- Costs are segregated into fixed and variable. Semi-variable costs are split into their fixed and variable components before anything else is done.
- Only variable costs are charged to products. Fixed costs never form part of product cost.
- Fixed costs are treated as period costs. They are written off in full against the contribution of that period.
- Inventory is valued at variable cost only. Closing stock and work in progress carry no share of fixed overhead.
- Contribution, not profit, is the key figure. Profitability of a product, department or order is judged by its contribution.
- Selling prices may be based on contribution. In the short run a price above variable cost adds to contribution and is worth considering.
- Profit is not affected by changes in stock levels, because no fixed cost is carried forward in inventory.
Marginal Costing Example
A company sells its product at ₹100 per unit. Variable cost is ₹60 per unit and total fixed costs are ₹2,00,000 per year. Current output and sales are 8,000 units.
Step 1: Contribution per unit
= Selling price minus Variable cost
= ₹100 minus ₹60 = ₹40 per unit
Step 2: Total contribution
= 8,000 × ₹40 = ₹3,20,000
Step 3: Profit
= Contribution minus Fixed cost
= ₹3,20,000 minus ₹2,00,000 = ₹1,20,000
Step 4: P/V Ratio
= (40 ÷ 100) × 100 = 40%
Step 5: Break Even Point
In units = ₹2,00,000 ÷ ₹40 = 5,000 units
In value = ₹2,00,000 ÷ 0.40 = ₹5,00,000
Step 6: Margin of Safety
Actual sales = 8,000 × ₹100 = ₹8,00,000
Margin of Safety = ₹8,00,000 minus ₹5,00,000 = ₹3,00,000, which is 3,000 units
Margin of Safety ratio = (3,00,000 ÷ 8,00,000) × 100 = 37.5%
Verification: Profit = Margin of Safety × P/V Ratio = ₹3,00,000 × 40% = ₹1,20,000. This matches Step 3.
Step 7: Sales required for a target profit of ₹1,60,000
= (₹2,00,000 + ₹1,60,000) ÷ ₹40 = 9,000 units, or ₹9,00,000 in value
The marginal cost statement
| Particulars | Amount (₹) |
|---|---|
| Sales (8,000 × ₹100) | 8,00,000 |
| Less: Variable cost (8,000 × ₹60) | 4,80,000 |
| Contribution | 3,20,000 |
| Less: Fixed cost | 2,00,000 |
| Profit | 1,20,000 |
Notice the structure. Contribution appears as a subtotal, and fixed cost is deducted only once at the bottom. That layout is the visible signature of marginal costing.
Marginal Cost Curve and Graph
Why the marginal cost curve is U-shaped
Plot marginal cost on the vertical axis and output on the horizontal axis and you get a U-shaped curve. The reason is the law of variable proportions, also called the law of diminishing marginal returns.
At low levels of output, adding more variable input to the existing fixed capacity produces increasing returns. Specialisation improves, machinery is used more fully, and each additional unit costs less than the last. Marginal cost falls.
Beyond a point, the fixed factor becomes a constraint. Workers crowd the same machines, overtime rates apply, machines are pushed past efficient speeds and wastage rises. Each additional unit now costs more than the last. Marginal cost rises.
The minimum point of the marginal cost curve is where increasing returns give way to diminishing returns.
Three relationships worth memorising
- The MC curve cuts the AVC curve at the AVC minimum. When marginal cost is below average variable cost, it pulls the average down. When it is above, it pushes the average up. The two are equal exactly at the lowest point of AVC.
- The MC curve cuts the ATC curve at the ATC minimum, for the same reason.
- Fixed cost does not affect marginal cost. Since MC is the derivative of total cost and fixed cost is a constant, it disappears on differentiation. This is why MC can also be written as the change in total variable cost.
The break even chart
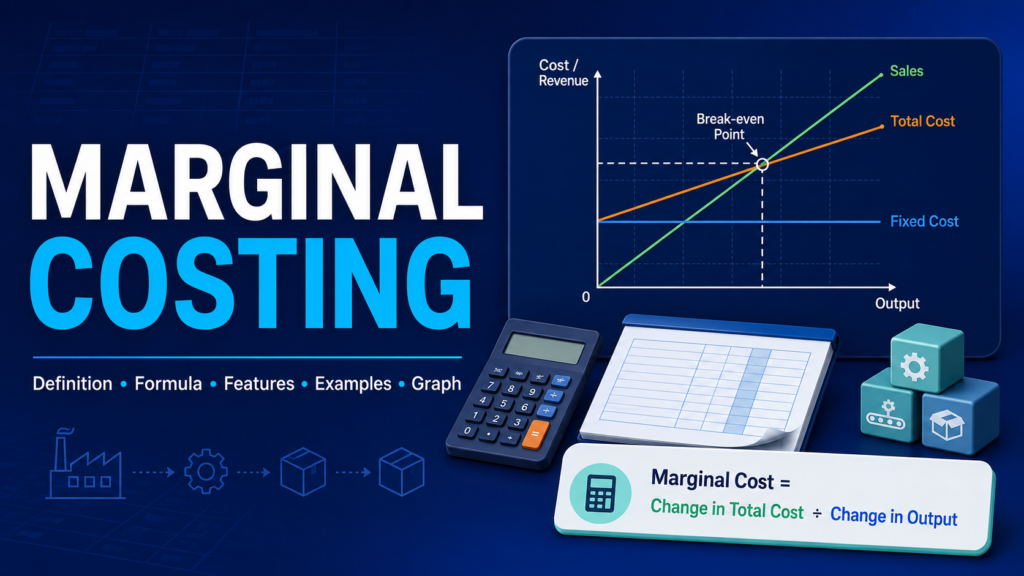
In cost accounting the relevant graph is different. On a break even chart, sales value is plotted on the vertical axis and output on the horizontal axis.
- The fixed cost line is horizontal, since fixed cost does not change with output
- The total cost line starts at the fixed cost level on the vertical axis and slopes upward at the rate of variable cost per unit
- The sales line starts at the origin and slopes upward at the selling price per unit
- The point where the sales line crosses the total cost line is the break even point
- The vertical gap between the sales line and the total cost line to the right of that point is profit, and to the left of it is loss
- The horizontal distance from the break even point to the actual sales level is the margin of safety
Using the figures from the example above, the sales line and total cost line intersect at 5,000 units, or ₹5,00,000 in value.
Marginal Cost and Marginal Revenue
Marginal revenue is the additional revenue earned from selling one more unit.
Marginal Revenue = Change in Total Revenue ÷ Change in Quantity
The central rule of production economics is that profit is maximised at the output level where marginal cost equals marginal revenue, provided the marginal cost curve is rising at that point.
The logic is straightforward. If marginal revenue exceeds marginal cost, the next unit adds more to revenue than to cost, so producing it increases profit. If marginal cost exceeds marginal revenue, the next unit costs more than it earns, so producing it reduces profit. Profit stops rising exactly where the two are equal.
Under perfect competition, price is constant regardless of how much the firm sells, so marginal revenue equals price. The profit maximising condition becomes MC = MR = Price. Under monopoly or imperfect competition, the firm must lower price to sell more, so marginal revenue falls faster than price, and marginal revenue lies below the demand curve.
This is the same reasoning that underlies the accountant’s rule about special orders. Accept an order if the price exceeds marginal cost and spare capacity exists, because the additional revenue exceeds the additional cost.
Marginal Costing vs Absorption Costing
| Basis | Marginal Costing | Absorption Costing |
|---|---|---|
| Treatment of fixed cost | Period cost, written off fully | Product cost, absorbed into units |
| Inventory valuation | Variable cost only | Variable plus fixed factory overhead |
| Key figure reported | Contribution | Gross profit |
| Profit when production exceeds sales | Lower | Higher |
| Profit when sales exceed production | Higher | Lower |
| Apportionment of fixed overhead | Not required | Required, often arbitrary |
| Suitability for short term decisions | High | Low |
| Acceptability for external financial reporting | Not permitted under AS 2 and Ind AS 2 | Required |
The last row matters in practice. A company may use marginal costing internally for decisions while still preparing its published financial statements on an absorption basis, because inventory valuation standards require fixed production overheads to be included.
Marginal Costing Benefits
Simplicity. No arbitrary apportionment of fixed overheads is needed, which removes a major source of distortion and dispute between departments.
Better decision making. Because fixed costs are irrelevant to short run decisions, marginal costing presents exactly the information a manager needs to accept or reject an order, make or buy a component, or drop a product.
Effective cost control. Variable costs are largely controllable at the operating level while fixed costs are controlled at the policy level. Separating them makes responsibility clearer.
No profit distortion from stock movements. Under absorption costing, building up stock defers fixed cost into inventory and inflates reported profit. Marginal costing removes this effect entirely.
Basis for profit planning. Break even analysis, margin of safety and target profit calculations all flow directly from the contribution concept.
Useful pricing guidance in difficult conditions. During a recession, for an export order, or when using spare capacity, any price above marginal cost adds to contribution and reduces the loss.
Supports key factor decisions. When a resource is scarce, ranking products by contribution per unit of the limiting factor gives the optimum product mix.
Applications in Decision Making
| Decision | Rule under marginal costing |
|---|---|
| Accept or reject a special order | Accept if price exceeds variable cost and spare capacity exists |
| Make or buy a component | Compare the buying price with the variable cost of making, plus any fixed cost that can be avoided |
| Drop a product or department | Retain if it earns a positive contribution, even if it shows a net loss after fixed cost allocation |
| Optimum product mix | Rank products by contribution per unit of the limiting factor |
| Shut down or continue | Continue in the short run if contribution exceeds avoidable fixed costs |
| Pricing | Price must at minimum cover variable cost in the short run, and full cost in the long run |
Limitations of Marginal Costing
Difficulty in segregating costs. Semi-variable costs such as electricity or supervision rarely split cleanly into fixed and variable components, and the split relies on estimation.
Unrealistic assumptions. The technique assumes fixed costs remain constant and variable cost per unit stays the same at all output levels. Neither holds over a wide range of activity.
Understates inventory value. Excluding fixed factory overhead from stock is not permitted under accounting standards for external reporting.
Ignores the long run. Fixed costs must eventually be recovered. Pricing consistently on the basis of marginal cost alone will destroy the business over time.
Less useful in capital intensive industries. Where fixed costs dominate the cost structure, a technique that sets them aside gives limited insight.
Assumes linearity. In reality, selling price may need to fall to sell additional volume, which breaks the straight line assumption behind the break even chart.
Common Mistakes to Avoid
Including fixed cost in marginal cost. Marginal cost is variable cost. If a question gives fixed overhead per unit, ignore it in the marginal cost figure.
Confusing contribution with profit. Contribution is sales minus variable cost. Profit is contribution minus fixed cost. They are equal only when fixed cost is nil.
Using total sales instead of contribution when computing the P/V ratio. The numerator is contribution.
Forgetting that the break even point rises when fixed cost rises. Any change in fixed cost changes the break even point but leaves the P/V ratio and contribution per unit untouched.
Rejecting a loss making product without checking contribution. A product showing a net loss after fixed cost allocation may still be earning positive contribution and should usually be retained.
Where Marginal Costing Takes You Next
Marginal costing is not a chapter that ends with an exam. It is the reasoning a factory manager uses when deciding whether to run a night shift, an airline uses when pricing an empty seat an hour before departure, and a startup founder uses when deciding whether a customer segment is worth serving. The mathematics is simple. The judgement about which costs are genuinely relevant to a decision is what takes practice.
Students who enjoy this topic are usually well suited to accounting, finance and management study. If you are choosing your path, the PU Commerce programme at Trinity College builds the accounting foundation at the pre university level, the B.Com programme among degree colleges in Mysore takes cost accounting and financial management to professional depth, and the BBA programme at Trinity College approaches the same decisions from a management and strategy angle.
Frequently Asked Questions
What is marginal cost in simple words?
Marginal cost is the extra cost of producing one more unit of a product. Since fixed costs do not change when output changes within existing capacity, marginal cost is made up entirely of variable costs such as direct material, direct labour, direct expenses and variable overheads.
What is the formula for marginal cost?
Marginal cost equals the change in total cost divided by the change in quantity produced. In cost accounting it is also calculated as direct material plus direct labour plus direct expenses plus variable overheads.
What is the difference between marginal cost and marginal costing?
Marginal cost is a figure, the additional cost of one more unit. Marginal costing is a technique in which only variable costs are charged to products and fixed costs are written off against contribution for the period.
Why is the marginal cost curve U-shaped?
Because of the law of diminishing marginal returns. At low output, increasing returns to the variable factor cause marginal cost to fall. Beyond a point, the fixed factor becomes a constraint, efficiency drops and marginal cost rises, producing a U shape.
What is contribution in marginal costing?
Contribution is sales minus variable cost. It can also be expressed as fixed cost plus profit. It represents the amount available from each unit sold to cover fixed costs and then generate profit.
At what point is profit maximised?
Profit is maximised at the output level where marginal cost equals marginal revenue, provided marginal cost is rising at that point. Beyond it, each additional unit costs more than it earns.
Is marginal costing allowed for financial reporting?
No. Inventory valuation standards including AS 2 and Ind AS 2 require fixed production overheads to be included in the cost of inventory, so external financial statements must be prepared on an absorption costing basis. Marginal costing remains widely used for internal decision making.
Final Word
The value of marginal costing lies in one habit: separating the costs that change with a decision from the costs that do not. Learn the formulas, but the exam question that separates strong answers from average ones is always the one asking whether to accept an order, drop a product or make a component. Answer those by asking what actually changes if the decision goes the other way. Everything else follows.
About the Author
Dr. Shama E M is the Principal of Trinity Institutions, Mysuru. With extensive experience in academic leadership and higher education, she works closely with faculty and students to strengthen conceptual clarity in commerce and management subjects and to guide students towards well informed academic and career decisions.